
Not-Your-average profit reports — the intro
As a chronic over-sharer, I’ve learned to weaponize my impulses into business strategies. “Talks too much” was a mainstay on my report cards. I like numbers. I like goals. And here we are. Luckily, oversharing about number goals serves a fabulous purpose, several really.
THE PURPOSE OF THE PROFIT REPORTS
1. They give an example as to how you can analyze your own numbers and make better, profit-driven decisions in your business.
Trying to grow a business without the numbers is like going on a road trip with no map. You might get somewhere fun, but if you end up in the mountains after wanting a beach vacation, you might be in trouble. Your numbers are the road signs you need directing you to the final destination.
2. A lot of us are in the dark as to what it actually takes to run a business. More transparency with numbers helps.
I love to interview other business owners about their revenue, expenses, and profit, but it’s a big ask. Many folks aren’t comfortable sharing. Some are, but they don’t stay on top of their bookkeeping enough to have meaningful conversations about the numbers.Plus, I feel like I gotta put my money where my mouth is and share my own if I want others to do the same.
3. TBH, it's just a good exercise to force myself to do what I need to do each month.
Who doesn’t love self-induced accountability. These profit reports require me to routinely do my bookkeeping, track my key performance indicators (KPIs), and actually take the time to thoughtfully consider where I am, how I’m progressing towards my goals, and how I may need to pivot.
The exercise is so valuable to me, that I implement the process in my programs and encourage our members to do their own profit reports even if they don’t plan to share publicly.
HOW TO DO YOUR OWN PROFIT REPORTS
If you like an audio breakdown, check out this episode from the Unf*ck Your Biz with Braden Podcast to learn my process. You can also and download this free guide on how to conduct your own profit report. It'll walk you through the exact steps I take to crunch my own numbers and set goals each month.
A QUICK REVIEW OF OUR CORE OFFERS
In each monthly profit report, I share my projections for revenue for each of our core offers. The following month, I reconcile that amount with what I actually earned. If you want to follow along, it’s helpful to get acquainted with our “core offers.” These are the ones that make up 95% of our revenue.
Always available,
$200 template hub
3,500 members and counting
Unf*ck Your Biz (UYB)
Open for new students each December
$2,000, 12-week signature program
200 graduates thus far
Always available
This includes: $200 trademark quickie searches, and the $1,550 trademark application filing service
At the time of writing this, I’ve done about 300 paid searches, 150+ trademark application filings, and have about 40 members in our maintenance offer
Bestie HQ
Opens each October and April
A $100/month mastermind
We haven’t launched it yet but hope for it to be a big success
Compliance Club
Always available
A $10/month or $100 lifetime monthly email newsletter membership
We have about 250 current members
We primary sell this through order bumps and upsells on our other offers
We have some smaller things like my book, small seasonal mini courses, and the like, but I rarely even consider them when doing income projections due to the low volume of sales.
The Contract Club® and Unf*ck Your Biz® are both flat fee, one-time payment programs. Both can be viewed as courses, but the Club is more of a template library that we regularly update and provide support for. Whereas UYB is a group coaching program that includes a robust course.
Trademarks are the only core offer that I’d classify as a done-for-you service. We do offer strategy sessions and occasional VIPs days for things like tax consulting, LLC formation, S Corps, and some other things, but those are more on a request-only basis.
And then the Compliance Club, Besties HQ, and our Trademark monitoring programs are all monthly recurring revenue (MRR) offers.
A FEW FUN CONCEPTS
Some of these are standard finance concepts and terms. Others are concepts that I may have made up (which may be concepts that do exist in the finance industry but that I self-discovered and gave my own name to and am now sharing with you).
These are good things for you to learn and understand for your own business and to understand the profit reports.
Baseline Revenue
Baseline revenue is the revenue you can almost guarantee you will earn each month. It isn’t technical, but I find it helpful. Look at what your lowest sales month of the year is for each offer. Assume you’ll have that many sales, calculate the revenue, and add to that any monthly recurring revenue you have (consider your churn rate as well).
The best way I can demonstrate is by example.
Year-to-day, 2026, here’s the lowest revenue I’ve had per month for each of my non-recurring payment offers:
Contract Club – $2,500
Trademarks – $6,000
Other – $2,000
And then my current monthly, recurring revenue offers:
Trademark Rx – $2,500
Compliance Club – $350
Profit Rx – $2,000
The total is: $15,350
And that’s not too far off because my actual lowest revenue month of the year was $17,500.
Essentially, my base revenue is the amount I’d expect to make if I took the month completely off of marketing and ran no special promotions. It’s the sales we naturally earn through affiliates, SEO, and already existing recurring payment plans. Of course if you consistently do no marketing your baseline revenue will fall off a cliff, so don’t do that.
When I start my profit projections for the following month, I begin with my baseline revenue numbers. For example, I always anticipate at least $2,500 in revenue from the Contract Club. I might have a speaking engagement on the calendar to a group of 50ish people where I know I’ll be promoting the Club. I’d estimate a 10% conversion rate, 10 sales at $200, so $2,000 more in revenue. Thus, my total projection for Contract Club revenue would be $4,500. I do this for each offer, and that’s how I project my revenue every month.
Profit Pie
I love me a profit pie. This is a fun name I give to a simple concept. Your profit pie is a pie chart. In its simplest form, there are two slices: expenses and profit. Here’s a visual using $100,000 in revenue.

A pie chart showing expenses equaling $41,800 and profit of $58,200.
If you have cost of goods, you could add that too.
I like to add one more slice for owner’s compensation or salary. This is particularly helpful for S corps and folks hoping to eventually have S corps. S corps are required to take a “reasonable salary.” That salary is reported on a W-2. It’s taxable income to the owner, and it’s a deductible business expense to the business. The business files an 1120S tax return claiming all of its expenses, including the salary. The owner then gets a K-1 showing the remaining profit.
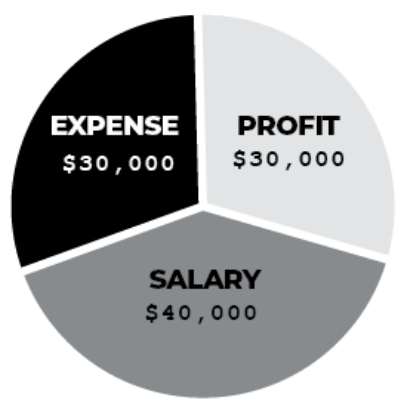
A pie chart showing expenses of $30,000, profit of $30,000, and salary of $40,000.
The profit pie also shows a crystal-clear tax picture. Each slice has a different tax treatment. Expenses are taxed at 0% because they get deducted from our income. Salary is subject to both income and self-employment taxes (in an S Corp). Profit is subject only to income tax and not self-employment taxes.
I use this profit pie visual in my presentations on S corps because it gives such a clear picture of how S corps are taxed. It’s also a powerful tool for your own business finances, which is why we include a profit pie in our bookkeeping template.
If you want to see how this really works, grab a copy of my book. I fully break it down there.
Month-Over-Month and Year-Over-Year
Full disclosure, I had to google this term. I’ve always just explained and written out this month’s revenue for August 2026 compared to the revenue I made in August 2025. A simple search taught me there’s a name for this, month-over-month revenue. Pretty simple!
This is a key metric because most of us have seasonality in our business. I know that November and December are my biggest revenue months every year. May and June tend to be my lowest revenue months. Early in my business, I expected revenue growth every month, but that’s not realistic.
This is obvious in businesses with clear seasonality like the wedding industry, or like a landscaping company in regions that have winters.
For the rest of you, you might be surprised to learn that you too have seasonality once you start tracking your month-over-month revenue. I learned eventually that my seasonality is inversely correlated with my clients’. I work with many professionals. They’re busy in the summer. More of them have time to work with me in their off season, winter.
“Year-to-date” (YTD) is simply your revenue, or expenses, or profit, or whatever starting from the beginning of the year to the current day. It’s fun to keep a running total of that along with YTD year-over-year revenue. E.g. $100,000 earned January 1 through August 31st in 2025 vs. $115,000 earned during the same period in 2026. That’s an increase of $15,000 in YTD year-over-year revenue. This can give a more holistic picture.
For example, My August may have been down compared to the previous August, but maybe that’s because last year, I did a big promotion the first week of August. This year, I did that promotion in the last week of July. This is why it’s good to keep a board overview of your year-in-review notes to quickly reference when you look at your numbers.